Untitled
Posts from April 2015
cello practice
-
Fip has a nice eclectic mix of music. Mostly classic jazz though they threw in Riders on the Storm this morning. What's the French phrase for "how very French"? [via mathowie]
morning sun
hazy sunday
Revolution Hall
Amtrak
rbhex3.gif

rbhex2.gif

rbhex1.gif

pots
-
Beautiful low-poly, animated, CSS-generated animals.
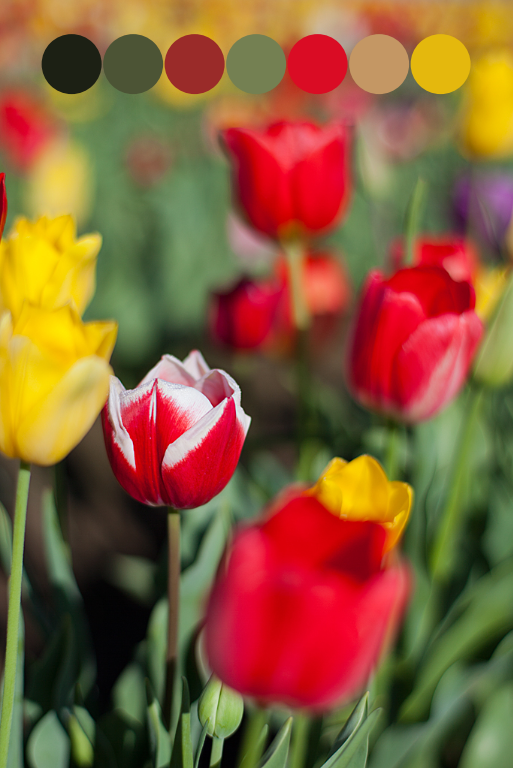
Palette Extraction
I stumbled on these neat palette-extraction images and wrote a script to create my own. There's a great article with code about using k-means clustering to find the dominant colors in an image. I use that code to find the colors and then plot the circles on top. Here's an example with one of my tulip pics from last week:

I think these are a nice way to visualize the colors in a picture.

I think these are a nice way to visualize the colors in a picture.


